
Measuring Churn in $: NRR, NDR and GRR
If you can't measure it you can't change it


Retention is critical to the success of subscription and usage based businesses. A 1% retention increase has a significantly larger impact than a 1% increase in conversion or top of funnel.
Before diving into retention strategies, it's essential to understand its counterpart, churn.
What is churn?
Churn is users ceasing to pay for your service, this may be an active choice which is called voluntary churn or something that happens without the user taking an action which is called involuntary churn.
Voluntary churn is users choosing to leave your product and often hold insights into product, onboarding or customer experience issues. Involuntary churn is often related to payment failure either due to insufficient funds, card expiry or other issues that the user didn’t intend to happen.
Understanding churn and retention in monetary terms, especially for companies with subscription or usage based models, can offer actionable insights. Three critical metrics stand out when assessing churn through the lens of revenue: GRR (Gross Revenue Retention), NRR (Net Revenue Retention), and NDR (Net Dollar Retention).
Looking only at churn: Gross Revenue Retention
Gross Revenue Retention provides an initial pulse check on how well a business retains its monetary value from existing customers. It's a straightforward metric, capturing only revenue retention, disregarding upsells.
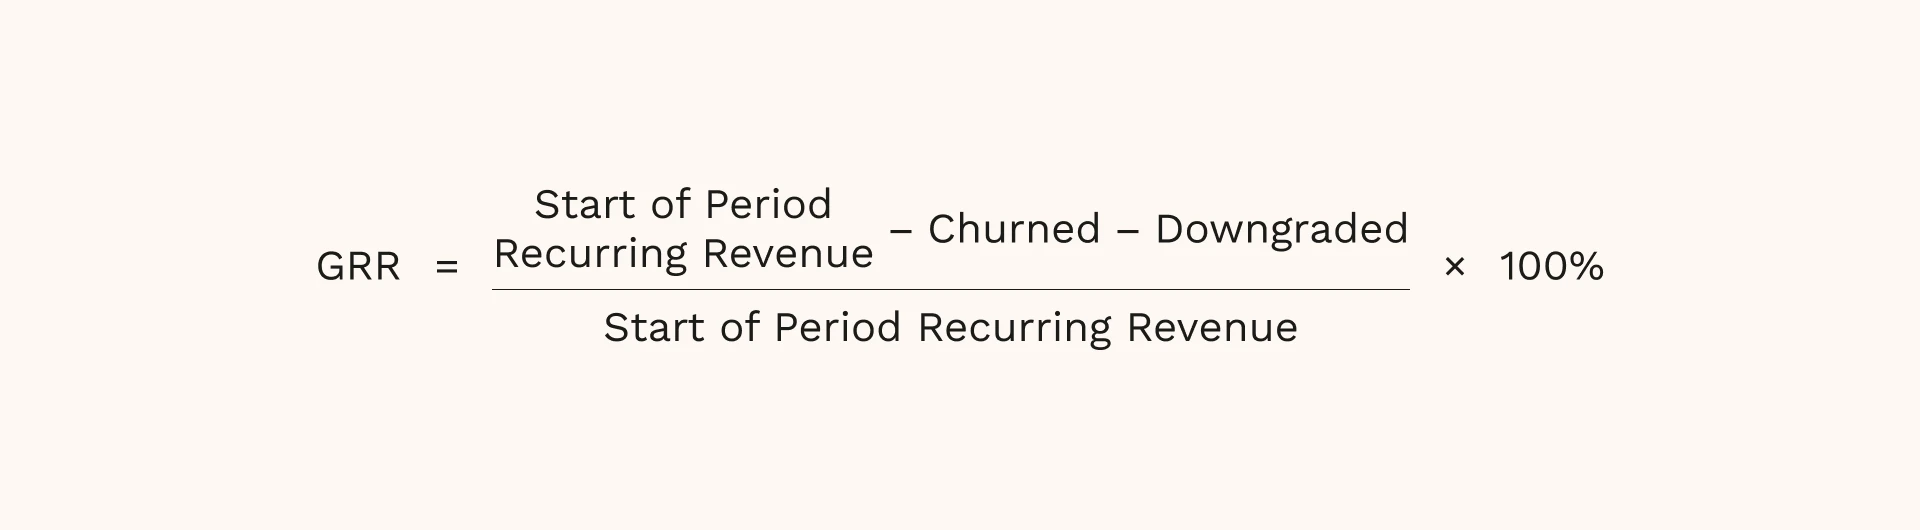
This formula gives a percentage that illustrates how much of your initial revenue (from existing customers) you managed to retain by the end of a given period.
Suppose you begin with a Monthly Recurring Revenue (MRR) of $10,000. By month-end, after excluding new customer revenue, if your MRR stands at $9,500, your GRR is 95%. This metric serves as a foundational understanding of churn, but to dig deeper, one should look at NDR and NRR.
A more comprehensive way: Net Dollar Retention & Net Revenue Retention
Net Dollar Retention and Net Revenue Retention is a more comprehensive metric, adding layers to the GRR by incorporating revenue from upsells or other forms of expansion. It offers a clearer picture of how existing customer behavior—like upgrading or downgrading their plans—impacts revenue.
This metric is a nice shortcut to how much growth the company can expect even if it adds no new customers. It also is a great way to measure the success of customer success teams as it looks at both retention and expansion aspects.
How are NDR and NRR different?
Net Dollar Retention and Net Revenue Retention are often used interchangeably, however there is a slight but important difference. NRR is used over a fixed 12 months period for all customers (eg. the last 12 months) vs a 12 month period relative to each customer (eg. the first 12 months of a customer being onboard). Generally speaking NDR is the metric you will be using.
How do you measure NDR and NRR

What should my NDR be?
NDR is becoming increasingly important as companies look to grow more efficiently, with 40% of a large company revenue coming from expansion. If your business has an NDR of more than 110% that is above the median and is considered good, and anything higher than 120% is considered great.
Conclusion
Measuring churn and retention by revenue is critical to understanding how well a business is performing. GRR is a good tool for measuring purely churn and NDR is good for measuring the impact of both retention and expansion efforts.
These metrics only detect churn after it happens, if you are looking to see who is going to churn before it happens you can use Upollo. Upollo uses AI to score customers based on their likelihood to churn and provides actionable insights on why.
Read the Report: Upollo SOC 2 Type 1
Join the Wave
Ready to revolutionize how you recognize opportunities? Sign up for the waitlist below and be among the first to experience its transformative power when it launches.
About the Author


Get Started for Free
Start understanding and upselling your customers today.